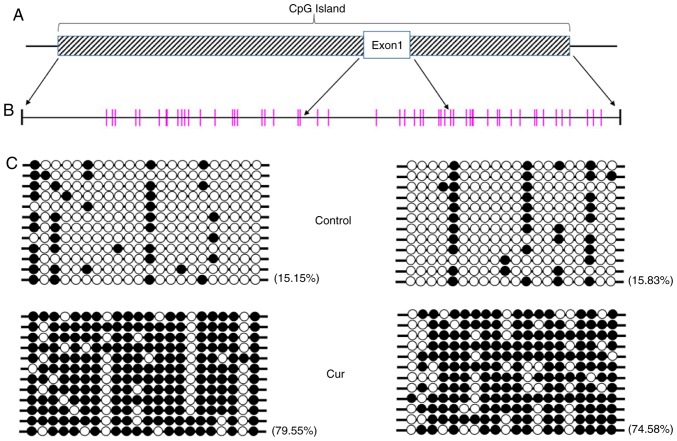
Figure 4.
Curcumin hypermethylates the promoter of mTOR in CpG sites. (A) Schematic diagram of the CpG island that begins upstream of the mTOR gene. The striped rectangle represents the CpG island and the blank rectangle represents mTOR exon 1. (B) CpG sites in the CpG island. Each vertical bar represents a CpG site. Two regions indicated by four arrows are CpG islands outside the first exon, which are the target detection areas. (C) The methylation level of the CpG sites in the promoter of mTOR in the curcumin-treated cells was significantly higher than that that in the control cells. Each line represents a sequencing reaction. The black circles represent methylated CpG sites, while the white circles represent unmethylated CpG sites. mTOR, mammalian target of rapamycin; Cur, curcumin.

