Figure 1.
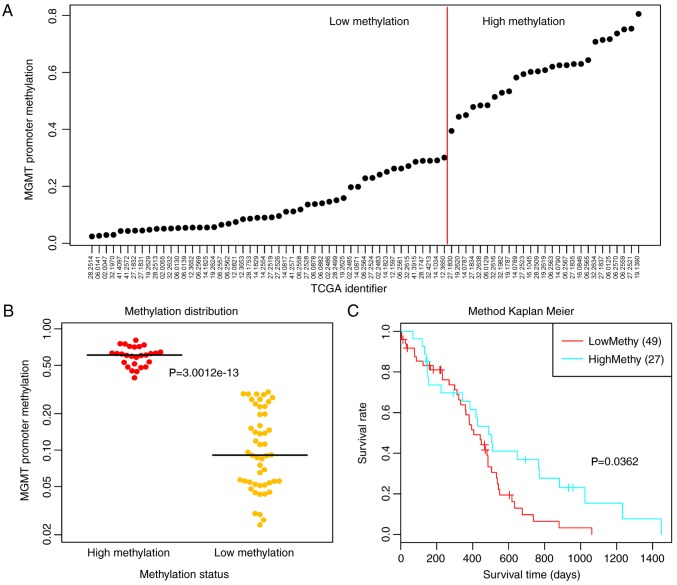
Classification and differential analysis of the 77 samples. (A) High and low methylation groups were divided according to the methylation levels of CpG islands in the promoter region of MGMT (red line indicates the cut-off point of methylation levels, 0.35); (B) Methylation differences of the high and low methylation groups. (C) Prognostic differences of high and low methylation groups. MGMT, O6-methylguanine-DNA methyltransferase; TCGA, The Cancer Genome Atlas.

