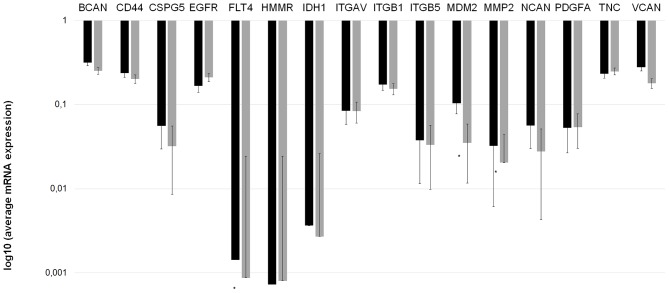
Figure 2.
Invasion spectrum (the mRNA expression pattern of invasion-associated extracellular matrix components) differs in patients with ‘worse’ and ‘better’ prognoses. mRNA expression measurements were performed twice for each gene to confirm the data. A longer bar on the logarithmic scale indicates reduced expression. *P<0.05 vs. group A (Mann-Whitney U test). Group A, OS <24 months; group B, OS >24 months; BCAN, brevican; CD44, cluster of differentiation 44; CSPG5, chondroitin sulfate proteoglycan 5; EGFR, epidermal growth factor receptor; FLT4, Fms-related tyrosine kinase 4; HMMR, hyaluronan-mediated motility receptor; IDH1, isocitrate dehydrogenase 1; ITGAV, integrin-αV; MDM2, murine double minute 2; MMP-2, matrix metallopeptidase 2; NCAN, neurocan; PDGFA, platelet-derived growth factor α; TNC, tenascin C; VCAN, versican; OS, overall survival.

