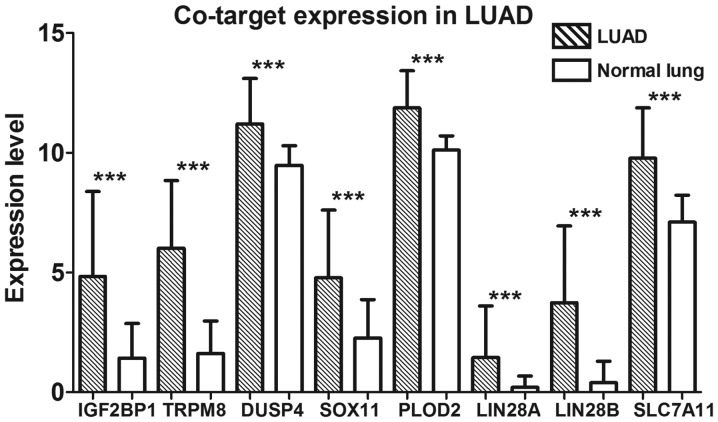
Figure 10.
Expression levels of the eight key co-targets of miRNA-126-3p and miRNA-126-5p. The bars in the histogram with oblique lines represent LUAD tissues, and the blank bars represent normal lung tissues. All eight genes were expressed significantly higher in the LUAD tissues (***P<0.001). LUAD, lung adenocarcinoma.

