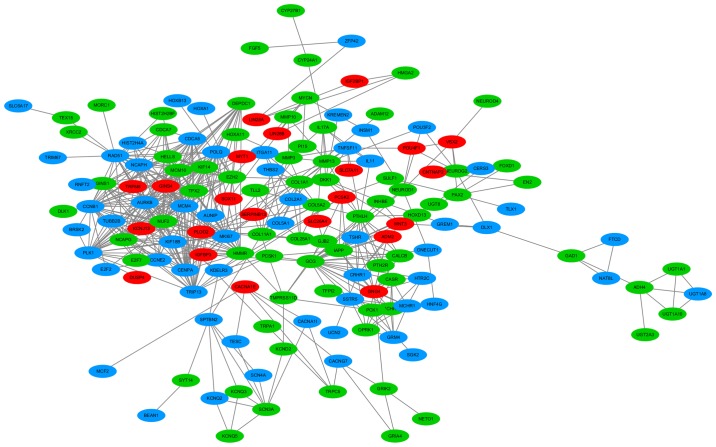
Figure 9.
PPI network based on 335 target genes of miRNA-126-3p and miRNA-126-5p. The blue nodes represent the target genes of miRNA-126-3p; the green nodes represent the target genes of miRNA-126-5p; the red nodes represent the co-regulated target genes of both miRNA-126-3p and miRNA-126-5p. The lines between the nodes represent the associations between the different target genes. PPI, protein-protein interaction.

