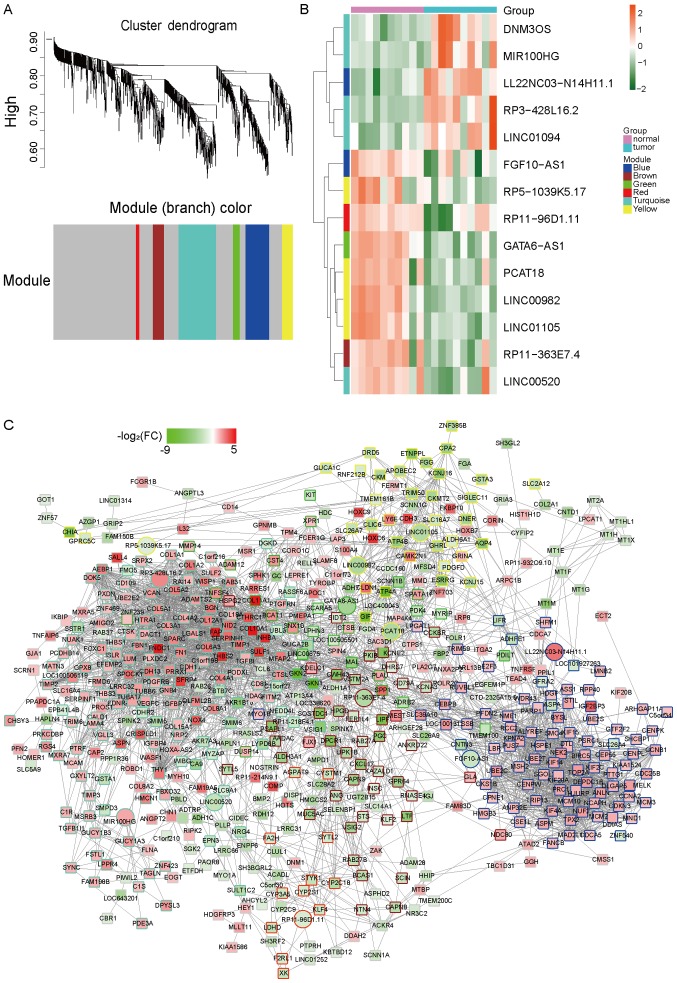
Figure 2.
LncRNA-mRNA co-expression network identified by WGCNA. (A) Hierarchical clustering of differentially expressed mRNAs and lncRNAs based on gene co-expression pattern across GSE79973. The different colors represent different co-expression network modules for the significant genes, except the grey color, which was assigned to genes that were not part of any module. (B) Heat map of the lncRNAs which were involved in the modules expressed between cancer and normal tissues, with red indicating higher expression and green indicating lower expression. The color of the vertical axis stands for which module the lncRNAs were from. (C) Co-expression network in the different modules. The fill color showed the log2FC of each gene; the border color showed the module the gene was from; the shape showed the type of gene: The ellipse indicates the mRNA and the triangle indicates the lncRNA. FC, fold-change; lncRNA, long non-coding RNA; WGNCA, weighted gene co-expression network analysis.

