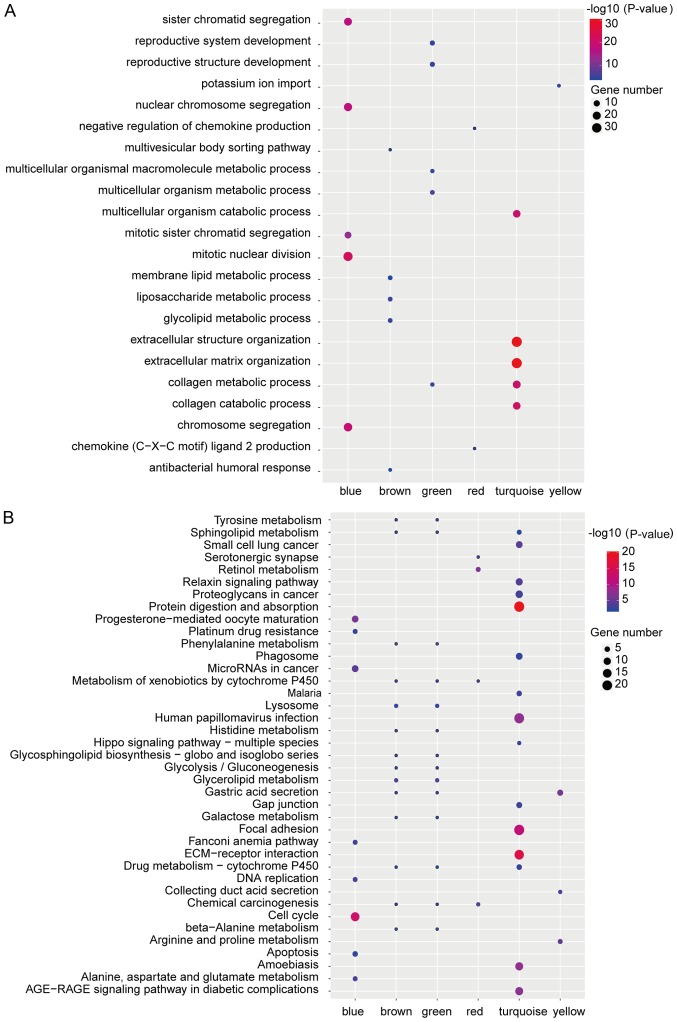
Figure 3.
Results of functional enrichment analysis of protein-coding genes in the different modules. (A) Gene Ontology biological process analysis results of the modules. (B) Kyoto Encyclopedia of Genes and Genomes pathway analysis results of the modules. The colors indicate the significance (-log10 transferred P-value) and the circle size represents the gene number of genes enriching the corresponding annotation.

