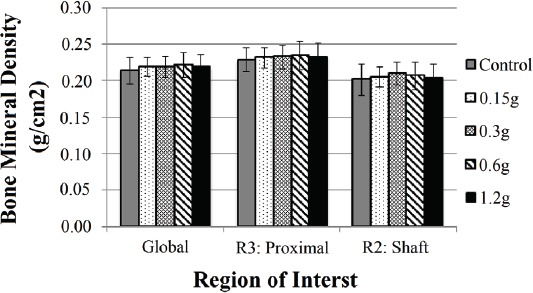
Figure 2.

Bone mineral density results for Root Mean Square Coefficient of Variation-vetted regions of interest (ROI) the “Global” region, the entire proximal femur down to the lesser trochanter, and a 4.6mm-long section of the mid-shaft. (Mean ± SD). No significant differences were found between groups for each ROI.
