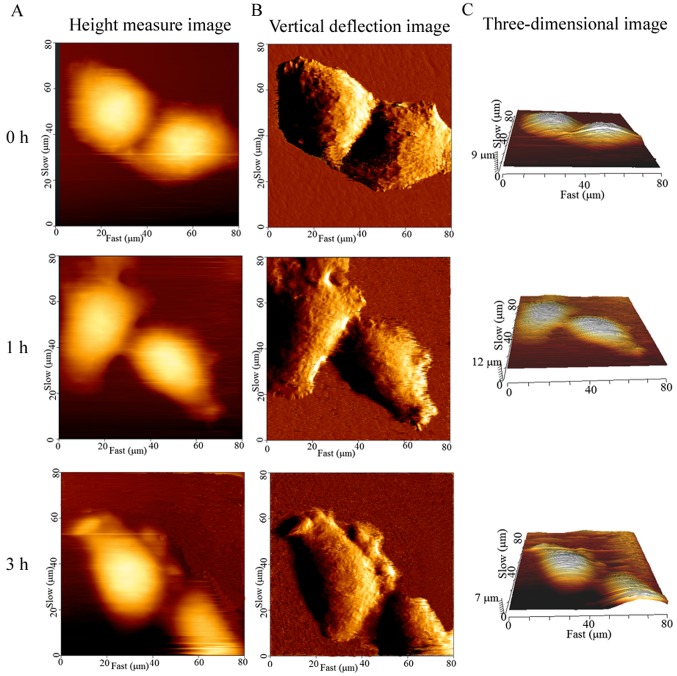
Figure 4.
Cell surface topography captured by atomic force microscopy at different time-points. (A-C) Height-measured, vertical deflection and three-dimensional images, respectively, at a scan scale of 80×80 µm are shown. The boundaries of the untreated cells are clear; however, the peripheries of treated cells became irregular and protrusions appeared.

