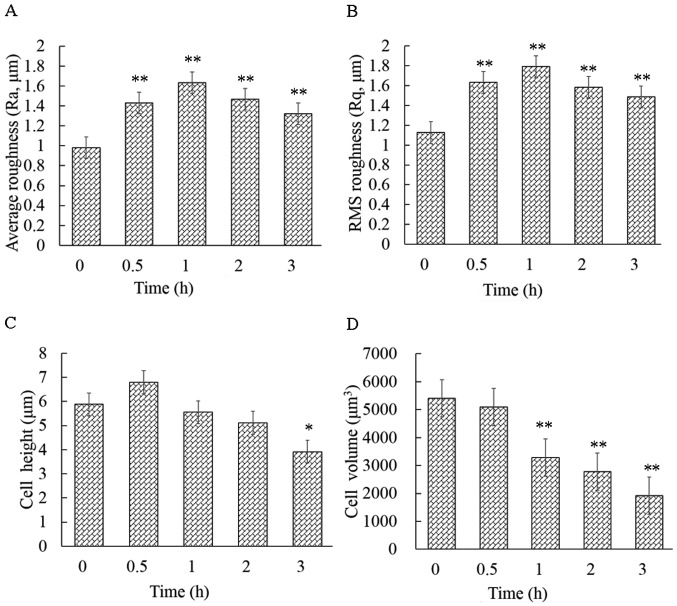
Figure 5.
Effects of cytochalasin B (CB) on surface roughness and geometry of HeLa cells. (A and B) The surface roughness parameters Ra and Rq increased significantly following treatment of the cells with CB, and reached their maximum value at ~1 h (P<0.01). (C) The cell height changed drastically, increasing at 0.5 h of exposure and subsequently decreasing. (D) The cell volume continuously declined (P<0.01). The results are presented as the mean ± standard deviation and were analyzed by one-way analysis of variance (ANOVA). *P<0.05 and **P<0.01. Ra, average roughness; Rq, root mean square (RMS) roughness.

