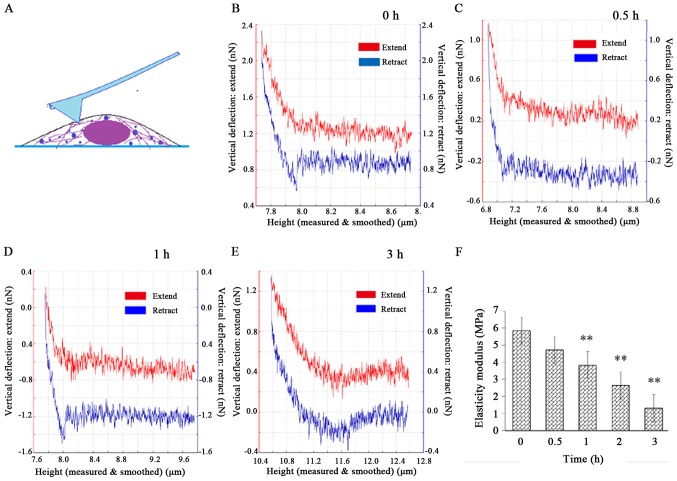
Figure 6.
Nanoindentation experiment on HeLa cells and analysis of results. Schematic diagram of the nanoindentation experiment: (A) The indentation points were selected in the cytoplasmic region around the nucleus. (B-E) The force-distance curves were obtained by nanoindentation with atomic force microscopy. The red lines denote the extend curves, and the blue lines represent the retract curves. (F) The elastic modulus of the cells gradually decreased, with a statistically significant difference at 1 h (P<0.01). The results are presented as the mean ± standard deviation and were analyzed by one-way analysis of variance. **P<0.01.

