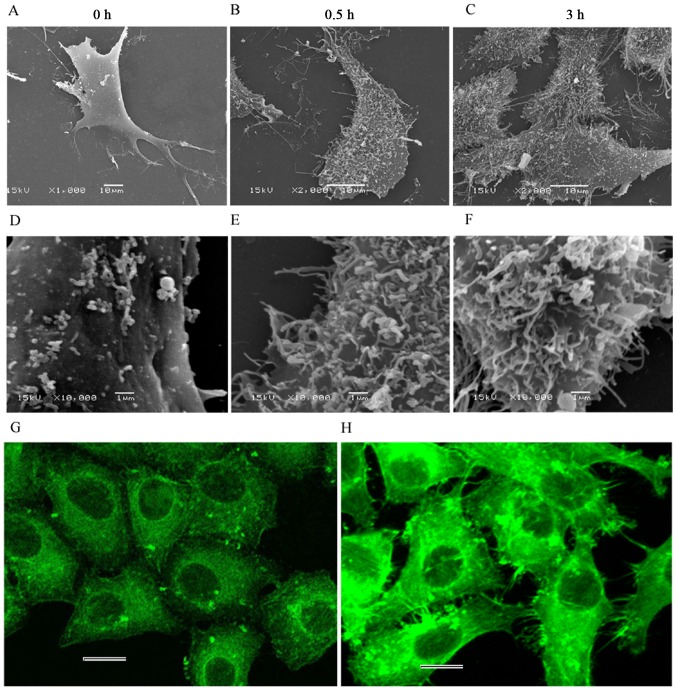
Figure 7.
Ultrastructure of HeLa cells observed by scanning electron microscopy and F-actin fluorescent staining. Overall views of the cell at (A-C) low magnification; and (D-F) partially enlarged views at high magnification. (A and D) Normal characteristics were observed for microvilli, lamellipodia and filopodia in control cells. (B and C, E and F) By contrast, the surface appeared considerably rough with numerous filamentous structures on the surface of the treated cells. (G) F-actin was uniformly distributed, while (H) numerous green fluorescent filaments appeared at the periphery of the CB-treated cells. Scale bars, 20 µm.

