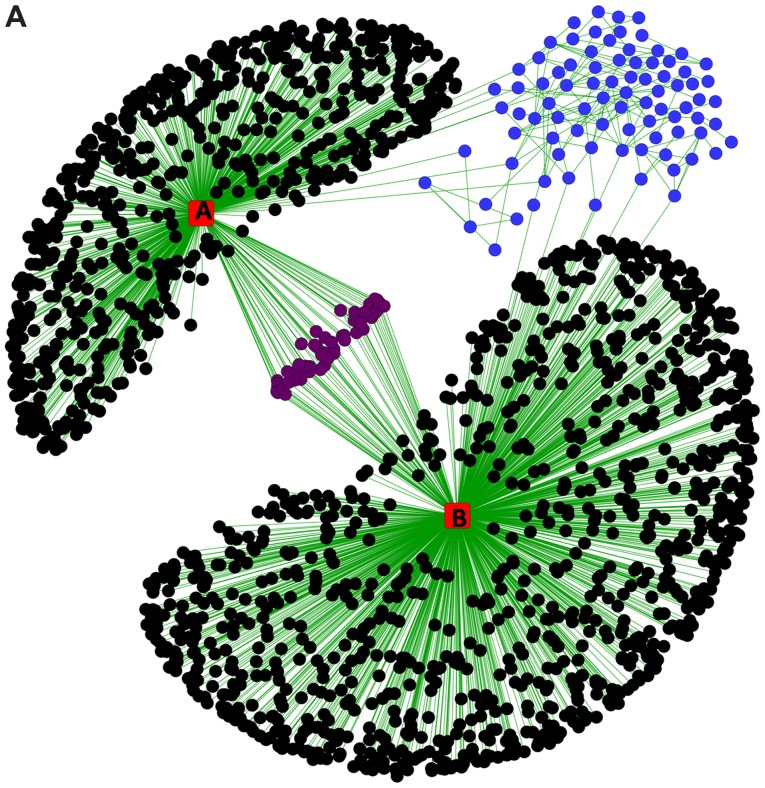
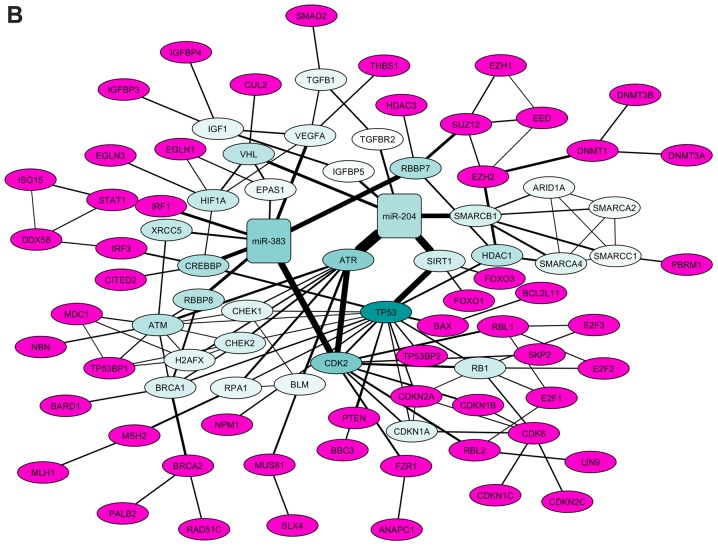
Figure 2.
miRNA-target regulatory interaction network. (A) miRNA-target regulatory network merged with the tumor suppressor genes protein interaction network. The red squares indicate miRNA nodes [(A) miR-383; (B) miR-204]. Black circles indicate targets (mRNAs) of single miRNAs, purple circles indicate targets shared by miRNAs and blue circles indicate tumor suppressor genes predicted to be targeted by one or both of the miRNA. The edges (lines) connecting two nodes are indicative of regulation (interaction). (B) Separated co-ordinate network showing the interactions between microRNAs and tumor suppressor genes. The node colors indicate the CV; pink gradient indicates CVs lower than average, blue gradient indicates CVs higher than average. Edge width indicates the betweenness measurement. miR/miRNA, microRNA; CV, centroid value.


