Figure 1.
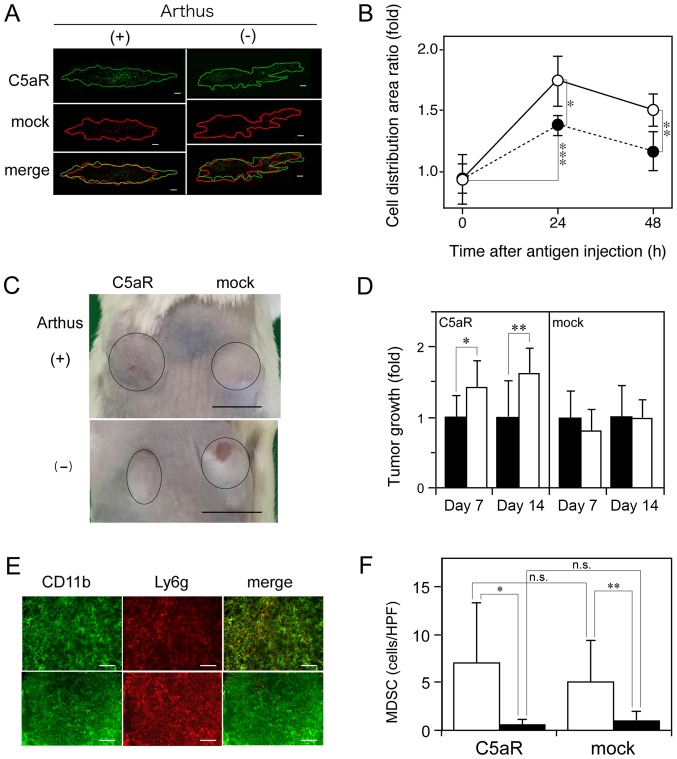
Promotion of C5aR-positive cancer cell invasion, tumor growth, and induction of MDSC recruitment by the Arthus reaction. Renca/C5aR cells (green) and Renca/mock cells (red) were labeled with different fluorescence probes, mixed, and injected subcutaneously into a wild-type mouse in combination with anti-ovalbumin mouse IgG or control IgG, followed by intravenous injection of ovalbumin (A, B) or with anti-BSA mouse IgG or control IgG, followed by intravenous injection of BSA (C-F). (A) Skin areas showing fluorescence from Renca/C5aR cells and Renca/mock cells (encircled in green and red lines, respectively), 24 h after ovalbumin injection. Scale bar: 200 µm. (B) Ratio of fluorescence distribution area of Renca/C5aR cells vs. that of Renca/mock cells was calculated. The values indicate the mean ± SD (n=4). Open circles: Anti-ovalbumin IgG; closed circles: Control IgG. Values were compared by analysis of variance (ANOVA) followed by Bonferroni multiple-comparison adjustment. *P=0.03, **P=0.067, ***P=0.008. (C) Images showing tumors at Renca cell-injected sites in the presence or absence of the Arthus reaction at day 14. Tumors are encircled in black lines. Scale bar: 1 cm. (D) Tumor growth at 7 and 14 days in sites subcutaneously injected with anti-BSA IgG (open column) or control IgG (closed column) after an intravenous BSA injection. Tumor size was measured and expressed as a ratio relative to the average tumor size in the absence of the Arthus reaction and vertical bars indicate the SD (n=6). *P=0.036, **P=0.021. (E) Fluorescence immunohistochemistry of Renca/C5aR cell-injected sites at day 14 using FITC-labeled anti-mouse CD11b rat IgG and Cy-5®-labeled anti-mouse Ly6g rat IgG. Upper and lower panels are from the sites where the Arthus reaction was induced or not, respectively. Scale bar: 50 µm. (F) MDSCs (CD11b+Ly6g+) were counted in the cancer tissues where the Arthus reaction was induced (open column) or not (closed column) and the average MDSCs/high-power field (HPF) ± SD (n=6) were recorded. Values were compared by Wilcoxon rank-sum (Mann-Whitney) test for nonparameric distribution followed by Bonferroni multiple-comparison adjustment. *P=0.031, **P=0.031, n.s, not significant.

