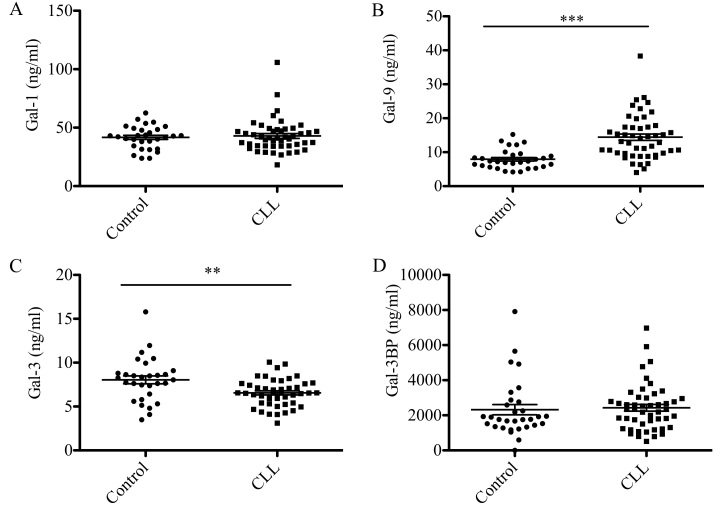
Figure 1.
Galectin serum levels in patients with CLL and the control group. Concentration of (A) galectin-1, (B) galectin-9, (C) galectin-3 and (D) galectin 3-binding protein was measured. Data are presented as the mean ± standard error of the mean. Control (n=30), CLL (n=48). Differences between two groups were analyzed using paired student's t-test. **P<0.001, ***P<0.0001. CLL, chronic lymphocytic leukemia.

