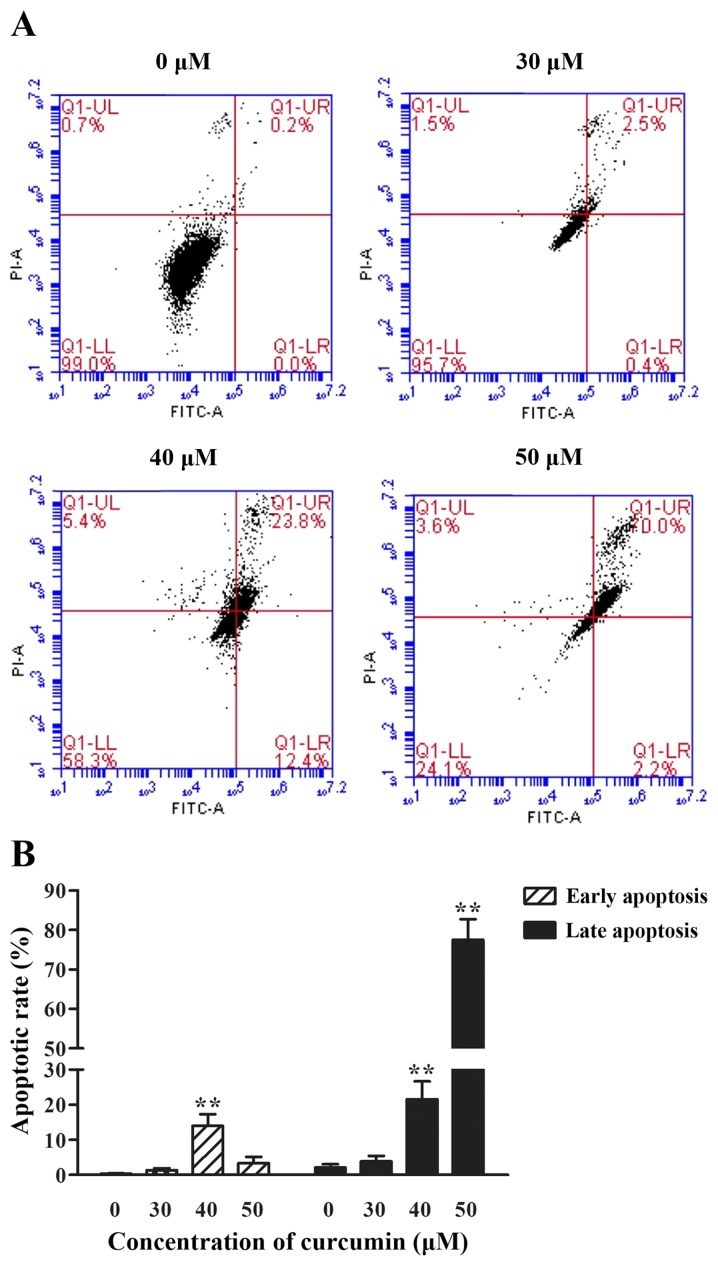
Figure 4.
The effect of curcumin on the apoptosis of P3X63Ag8 cells. (A) Flow cytometric dot plots of one representative experiment. Results are depicted as logarithmic fluorescence intensity on the x-axis (Annexin V-FITC) vs. y-axis (PI). A total of four quadrants represent necrotic cells (Q1-UL:AV-/PI+), late apoptotic cells (Q1-UR:AV+/PI+), early apoptotic cells (Q1-LR:AV+/PI-) and viable cells (Q1-LL:AV-/PI-). The numbers indicate the percentage of cells in each quadrant and a minimum of 10,000 events were read. (B) The histogram depicts the percentage of early and late apoptosis cells ± standard error of three independent experiments. **P<0.01 vs. the curcumin-untreated group. Cells were treated with 0, 30, 40 and 50 µM curcumin for 24 h. FITC, fluorescein isothiocyanate PI, propidium iodide.

