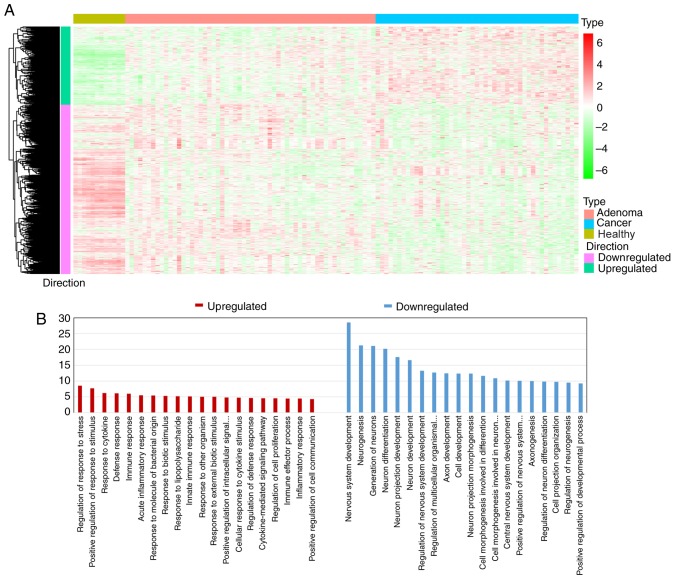
Figure 2.
Collection of consistent DEGs and GO enrichment analysis. (A) Heatmap of 1,282 consistent DEGs, including 405 upregulated DEGs and 877 downregulated DEGs, in human healthy colorectal samples and in CRC precancerous and cancer samples. Unsupervised clustering algorithm was used to cluster DEGs with a similar expression pattern during colorectal carcinogenesis. (B) GO enrichment analysis of consistent DEGs. Bar length represented the-log10 transformed FDR value. The results revealed that upregulated consistent DEGs indicated the genes that were associated with ‘immune response’, while downregulated DEGs indicated the genes that were associated with ‘cell development’ processes. FDR, false discovery rate; DEGs, differentially expressed genes; CRC, colorectal cancer; GO, Gene Ontology.

