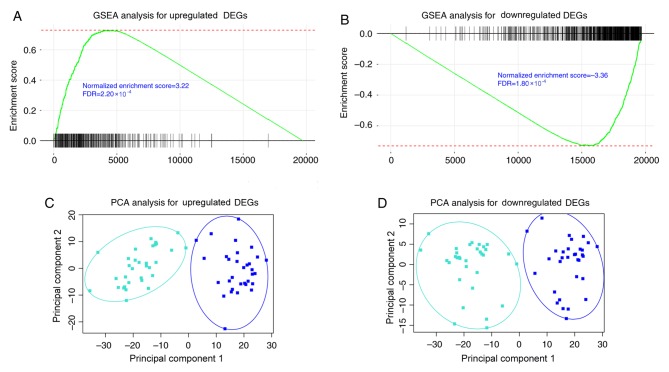
Figure 3.
GSEA analysis of consistent DEGs using TCGA paired data set. GSEA analysis was conducted with the consistent (A) upregulated and (B) downregulated DEGs. The two gene groups revealed a concordant differential expression pattern in TCGA paired data sets (FDR<0.001). Principal component analysis was conducted with the consistent (C) upregulated and (D) downregulated DEGs, indicating that consistent DEGs retrieved in the GSE71187 dataset were able to distinguish CRC samples from adjacent healthy tissues. PCA, principal component analysis; GSEA, gene set enrichment analysis; FDR, false discovery rate; CRC, colorectal cancer; DEGs, differentially expressed genes; TCGA, The Cancer Genome Atlas.

