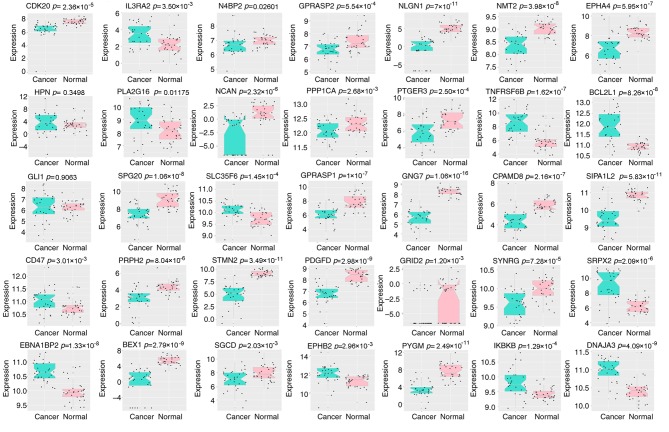
Figure 6.
Boxplot of 35 genes significantly affected by carcinogenic dysregulation in TCGA paired data. This illustration indicated that all the genes within this gene signature were significantly dysregulated during colorectal cancer carcinogenesis according to TCGA paired data, with the exception of HPN and GLI1. HPN, hepsin; GLI1, GLI family zinc finger 1; TCGA, The Cancer Genome Atlas.

