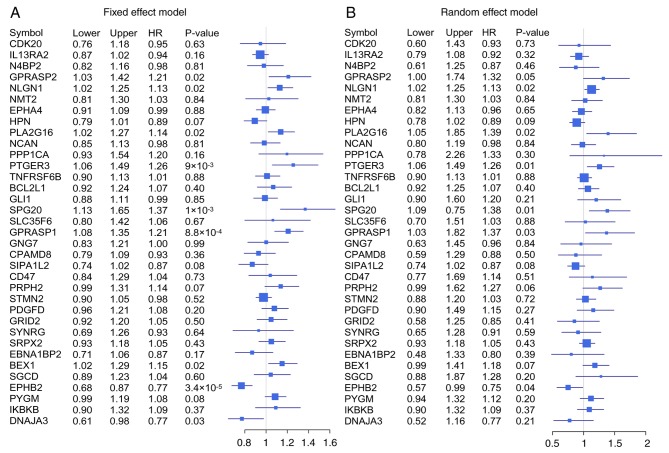
Figure 7.
Forest plots of the association between the 35 identified genes and survival in patients with colorectal cancer. (A) Forest plot of the 35 genes with the six independent cohorts using fixed effects model, calculated by pooling all the effect sizes from the six independent cohorts. (B) Forest plot using random effects model. HR, hazard ratio.

