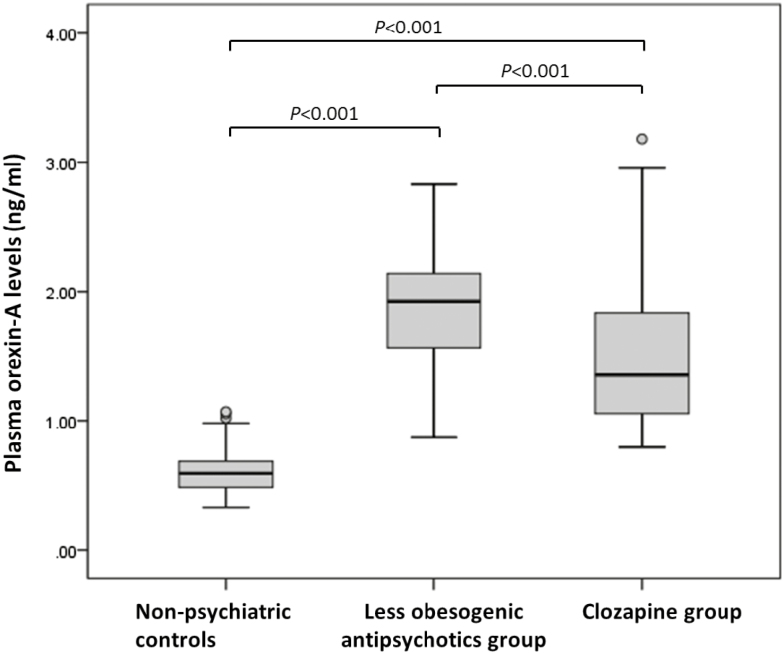
Figure 2.
Box plot of plasma orexin-A levels (ng/mL) in patients taking different antipsychotics and nonpsychiatric controls with comparisons by Welch’s 1-way ANOVA (posthoc multiple tests by the Games-Howell methods). The box plot whiskers indicate the highest, median, and lowest plasma orexin-A values that are no greater than 1.5 times the interquartile range, whereas the open circles are outlier values.

