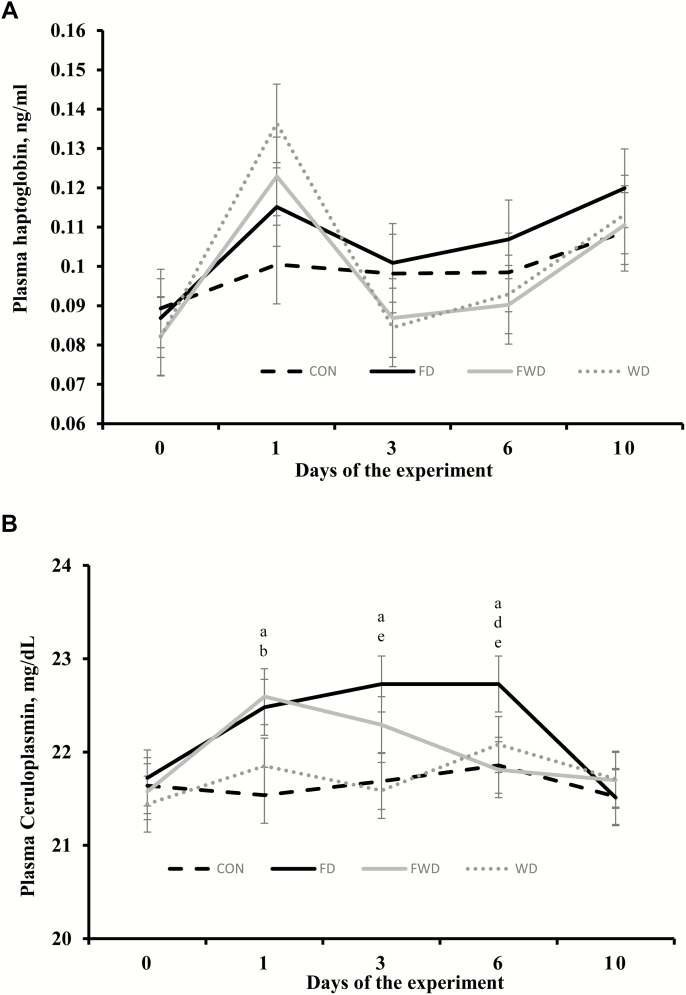
Figure 3.
Plasma haptoglobin (panel A) and ceruloplasmin (panel B) concentration of beef heifers subjected to 1) feed and water deprivation for 24 h (FWD), or 2) feed deprivation for 24 h, but regular access to water (FD), or 3) water deprivation for 24 h, but regular access to feed (WD), or 4) regular access to feed and water (CON). Treatments were concurrently applied from day 0 to day 1. Upon completion of treatment application (day 1), all pens received the same diet offered before treatment application. Values obtained from day −5 were used as an independent covariate within each experimental period. Therefore, results reported are covariately-adjusted least square means. A treatment × day interaction was detected (P < 0.01) for ceruloplasmin concentration. Within days, letters indicate the following treatment comparisons (P ≤ 0.05): a = CON vs. FD, b = CON vs. FWD, c = CON vs. WD, d = FD vs. FWD, e = FD vs. WD, and f = FWD vs. WD.

