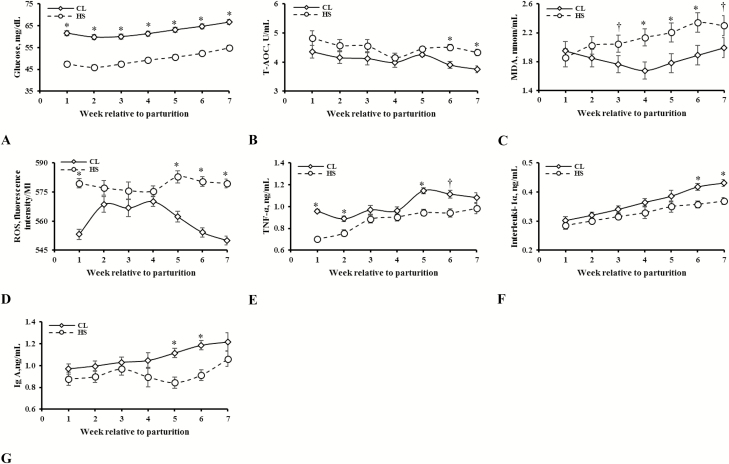
Figure 3.
Blood plasma glucose [(mg/dL; A) (SE = 1.03. Effects in model: treatment (T): P < 0.001; week (W): P < 0.001; T × W: P = 0.09)], total antioxidant capacity [(T-AOC; U/mL; B) (SE = 0.07. Effects in model: T: P < 0.001; W: P < 0.001; T × W: P = 0.05)], malondialdehyde [(MDA; nmol/mL; C) (SE = 0.10. Effects in model: T: P = 0.06; W: P < 0.001; T × W: P = 0.04)], reactive oxygen species [(ROS; fluorescence intensity/Ml; D) (SE = 2.00. Effects in model: T: P < 0.001; W: P < 0.001; T × W: P < 0.001)], tumor necrosis factor-α [(TNF-α; ng/mL; E) (SE = 0.01. Effects in model: T: P < 0.001; W: P < 0.001; T × W: P = 0.001)], interleukin-1α [(ng/mL; F) (SE = 0.01. Effects in model: T: P = 0.01; W: P < 0.001; T × W: P = 0.10)], and immunoglobulin A [(Ig A; ng/mL; G) (SE = 0.04. Effects in model: T: P = 0.006; W: P < 0.001; T × W: P = 0.03)] response following early-lactation exposure to either heat stress (HS) or cooling (CL). For each time point, * denotes significant difference at P ≤ 0.05 and † a tendency at P ≤ 10.

