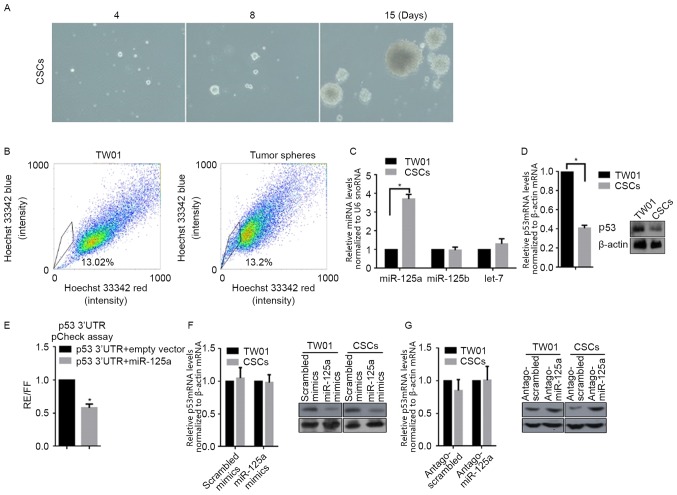
Figure 1.
Identification of isolated CSCs from TW01 and detection of the changes in miR-125a and p53 mRNA levels. (A) CSCs isolated from TW01 imaged at days 4, 8 and 15 (×40). (B) Side population analysis of isolated CSCs, compared with parental TW01 cells. (C) Expression level of miR-125a in CSCs, compared with parental TW01 cells by reverse transcription-quantitative polymerase chain reaction relative to U6 snRNA. *P<0.05, vs. TW01 group. (D) The mRNA and protein levels of p53 in CSCs and TW01 using western blot analysis relative to β-actin. *P<0.05, vs. TW01 group. (E) Regulation of the p53 3′-UTR by miR-125a. *P<0.05, vs. p53 3′UTR+empty vector group. (F) The mRNA (left panel) and protein (right panel) levels were detected following transfection of scrambled mimics or miR-125a mimics. (G) The mRNA (left panel) and protein (right panel) levels were detected following transfection of antago-scrambled or antago-miR-125a.

