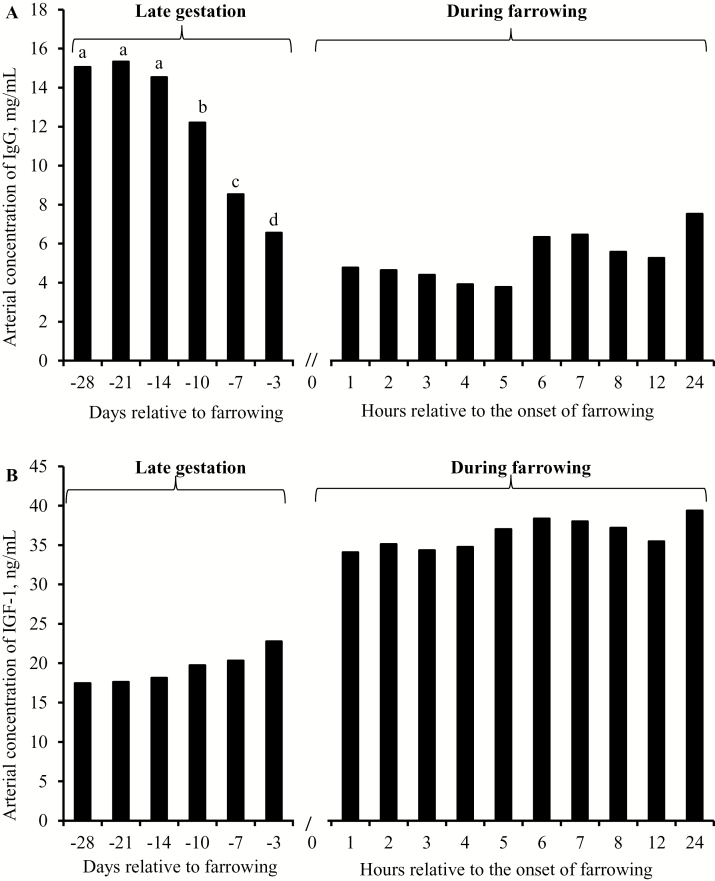
Figure 1.
Arterial concentrations of (A) IgG and (B) IGF-I in sow plasma during late gestation and during the initial 24 h after the onset of farrowing. Note that the scales on the abscissa are not equal; i.e., represented in days during late gestation whereas represented in hours after the onset of farrowing. Data obtained in late gestation and after the onset of farrowing were analyzed separately. a–dMeans without common superscripts differ (P < 0.05). Day 0 is the day of farrowing.

