Figure 4.


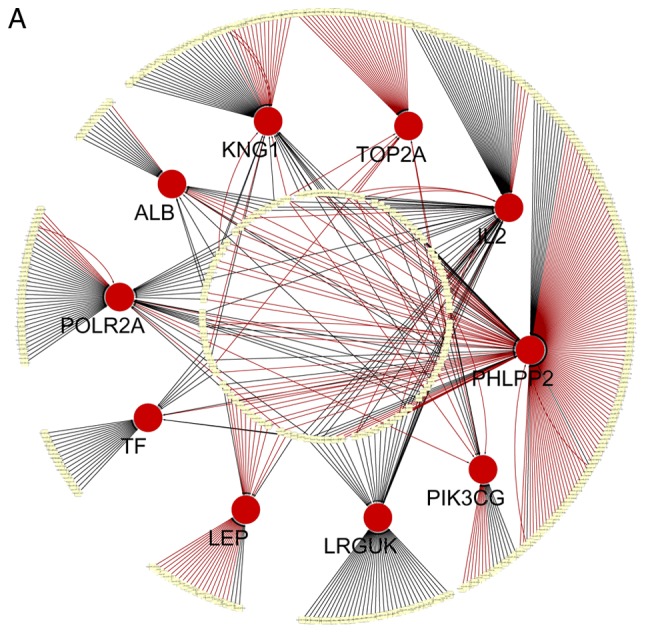
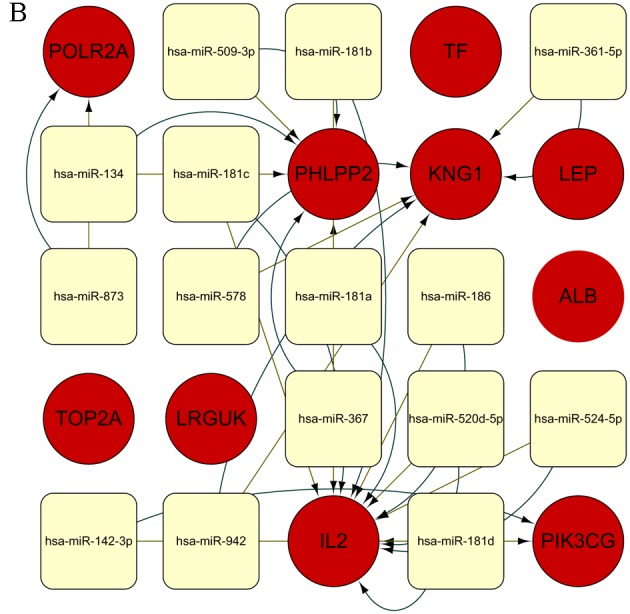
miRNA regulation of genes. (A) Extended regulatory network of miRNAs and target genes. The MTIs obtained from the MicroCosm database (n=305) and TargetScan database (n=277) are indicated in black and red, respectively. The overlap threshold function was set to display only MTIs present in 2 regulatory interaction networks. (B) Defined number of predicted miRNAs and target genes. Genes and miRNAs are denoted as red circles and yellow rounded rectangles, respectively. Additionally, green edges represent MTIs from the database TargetScan v6.2, and yellow edges represent MTIs from the database MicroCosm v5.0. The names of the genes and miRNAs are displayed on the nodes. miRNA, microRNA; MTI, microRNA-target interaction.
