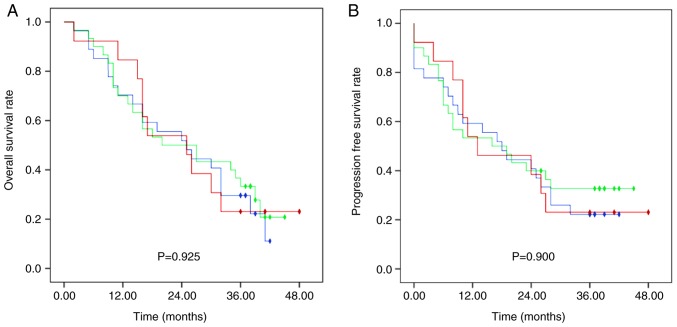
Figure 1.
Survival outcomes of patients in the three treatment groups. Kaplan-Meier curves displaying (A) overall survival rates and (B) progression-free survival rates for patients in the S-1, nedaplatin and radiotherapy group (blue), docetaxel, nedaplatin and radiotherapy group (green) and nedaplatin and radiotherapy group (red). Rhombus, censored value.

