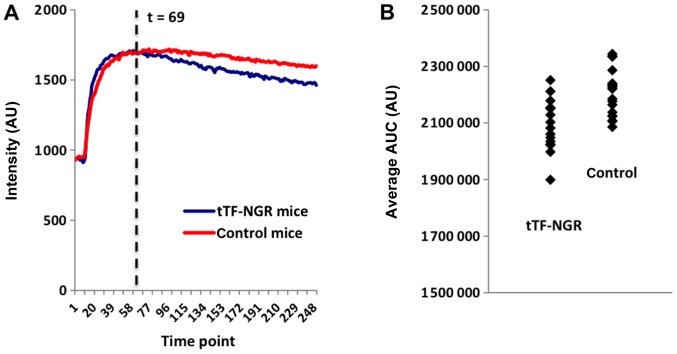
Figure 4.
(A) Comparison of the average smoothed intensity curves of the tTF-NGR and the control animals. The intensities were normalized at the time medication was given; the curves represent the smoothed intensities at each time point, averaged across all animals within the control group (red), and averaged across all animals treated with tTF-NGR (blue). Each time point represents a dynamic MR measuring phase (7.3 sec each), which defines time points 0 (0 sec) to 250 (1,825 sec), and time point 69 (~500 sec). (B) Comparison of the individual AUC values for the time period 8.3 to 30 min (α=1%). Individual AUC values (derived from the smoothed intensity curves) for both the tTF-NGR and the NaCl group. Please note that for illustration purposes the y-axis does not start at 0. AUC, area under the curve; tTF, truncated tissue factor.

