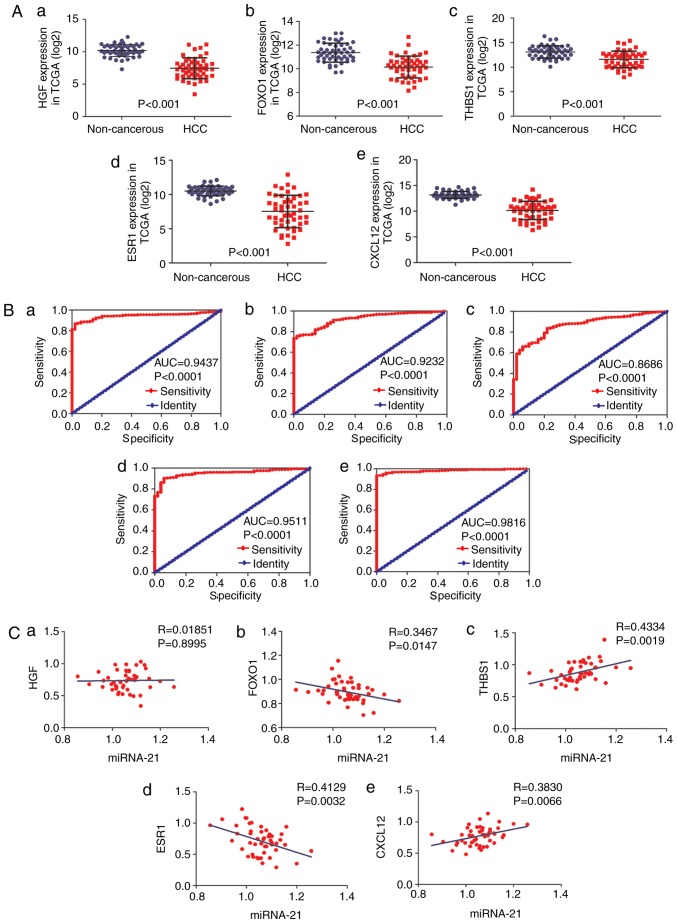
Figure 11.
Expression levels, ROC curves and correlation analysis of the 5 hub genes. (A) Expression levels of (a) HGF, (b) FOXO1, (c) THBS1, (d) ESR1 and (e) CXCL12 in HCC tissues and non-cancerous tissues from TCGA data. (B) ROC curves of (a) HGF, (b) FOXO1, (c) THBS1, (d) ESR1 and (e) CXCL12 in HCC from TCGA data. (C) Correlation analysis of (a) HGF, (b) FOXO1, (c) THBS1, (d) ESR1 and (e) CXCL12 and miR-21-5p from TCGA data. HCC, hepatocellular carcinoma; TCGA, The Cancer Genome Atlas; ROC, receiver operating characteristic; HGF, hepatocyte growth factor; FOXO1, forkhead box 1; THBS1, thrombospondin 1; ESR1, estrogen receptor 1; CXCL12, C-X-C motif chemokine ligand 12.

