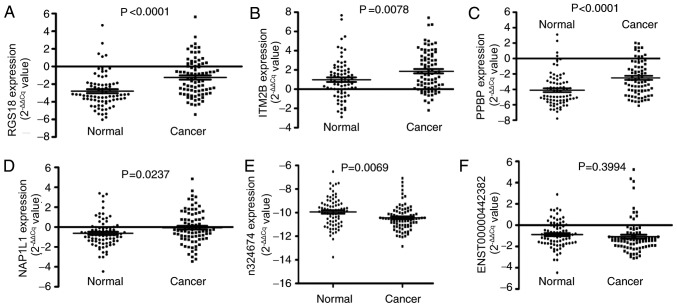
Figure 2.
Large-scale training plasma samples of patients with GC (n=81) and healthy participants (n=77) of candidate RNAs. (A) Scatter plots of plasma levels of regulator of G-protein signaling 18. (B) Scatter plots of plasma levels of integral membrane protein 2B. (C) Scatter plots of plasma levels of pro-platelet basic protein. (D) Scatter plots of plasma levels of nucleosome assembly protein1-like 1. (E) Scatter plots of plasma levels of n324674. (F) Scatter plots of plasma levels of ENST00000442382. Expression levels of RNAs (2−ΔΔCq scale y-axis) were normalized to that of the 18S rRNA gene. RGS18, regulator of G-protein signaling 18; ITM2B, integral membrane protein 2B; PPBP, pro-platelet basic protein; NAP1L1, nucleosome assembly protein1-like 1.

