
Figure 1.
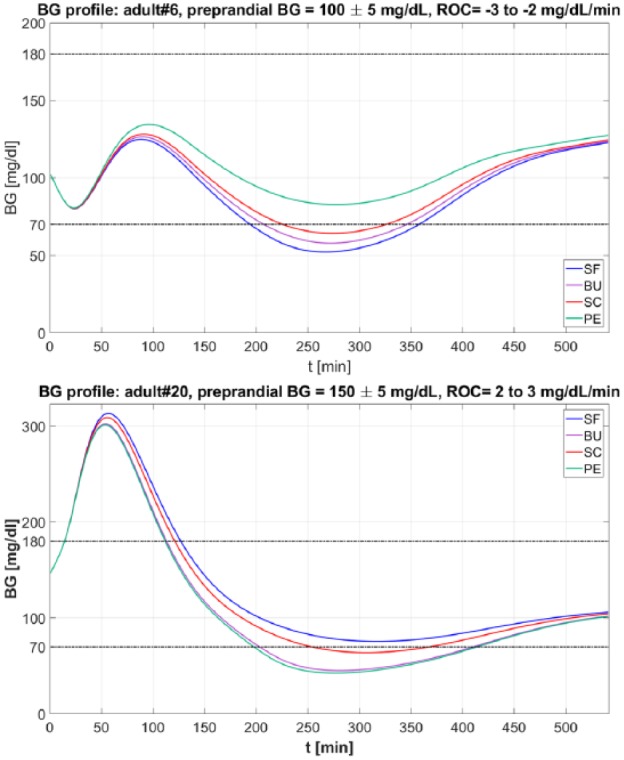
Example of BG trace obtained with SF (in blue), BU (in violet), SC (in red), PE (in green), and BU (in violet) methods. Top panel. BG profiles obtained for the virtual subject adult 6 when preprandial ROC is −3 to −2 mg/dL/min and preprandial BG is 100 ± 5 mg/dL. Bottom panel. BG profiles obtained for the virtual subject adult 20 when ROC is 2 to 3 mg/dL/min and preprandial BG is 150 ± 5 mg/dL.