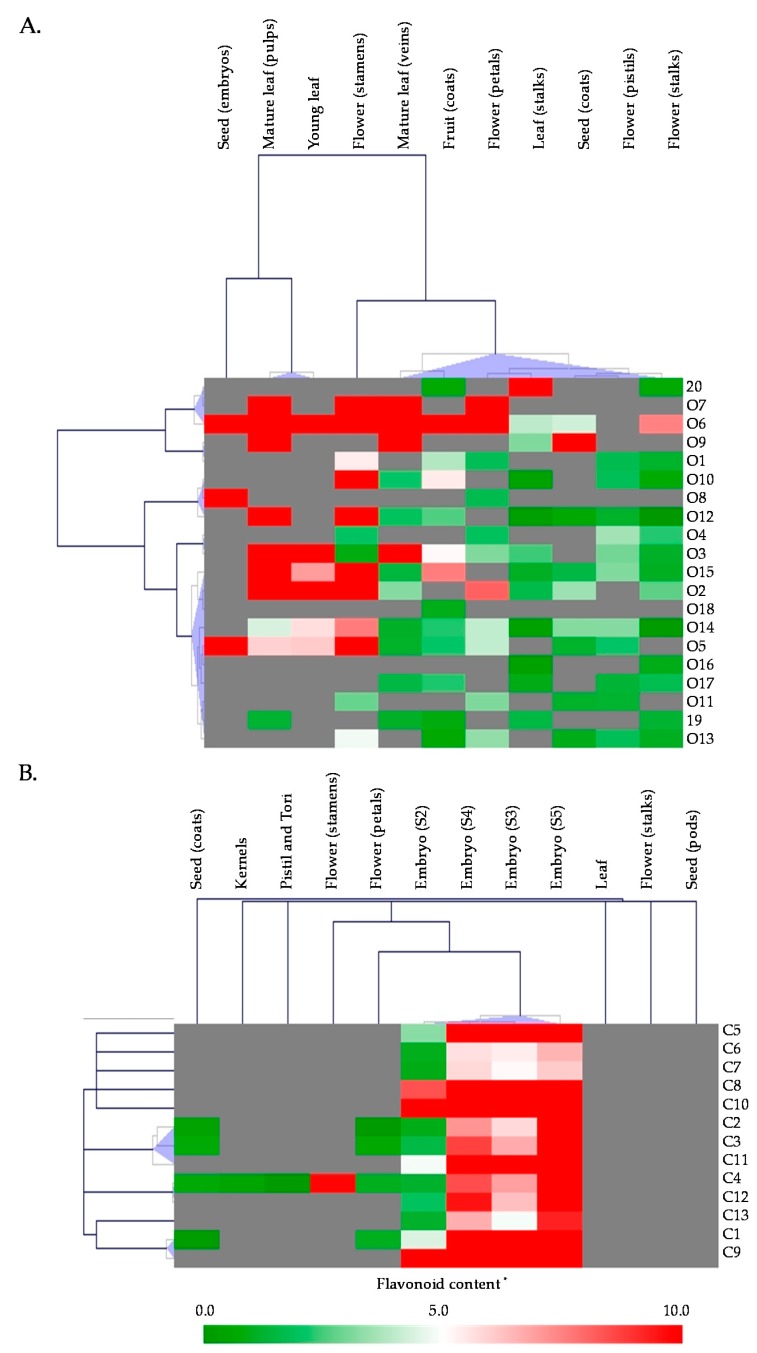
Figure 4.
Comparative analysis of flavonoid contents and compositions different tissues of Nelumbo nucifera. Data were compiled from Chen et al. [33] and Li et al. [35]. (A) Comparative analysis of flavonoids aglycones and FOGs in 11 different tissues. (B) Comparative analysis of FCGs in 12 tissues and/or developmental stages including embryo (the major accumulation site of FCGs in Nelumbo nucifera) at five maturation stages. The names and structures of the flavonoids are presented in Figure 3. * Contents are expressed in mg.100 g−1 FW for all tissues except for seed embryo for which contents are expressed in mg.100 g−1 DW in (A)).

