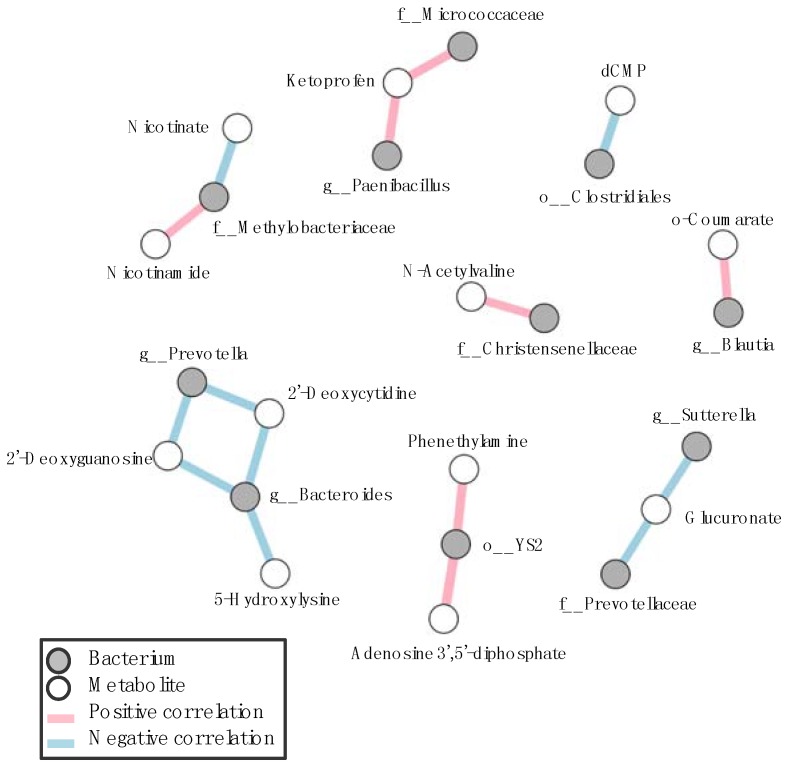
Figure 4.
Correlation networks between gastrointestinal microbes and metabolites in SPF mice. Correlation plots of pairwise correlations among gastrointestinal microbe-metabolite were calculated by Spearman’s rank correlation coefficient. Positive and negative correlations at the cut off level of the p value of 0.05 are shown as red and blue lines, respectively. Gray and white circles indicate gastrointestinal microbes and metabolites, respectively.

