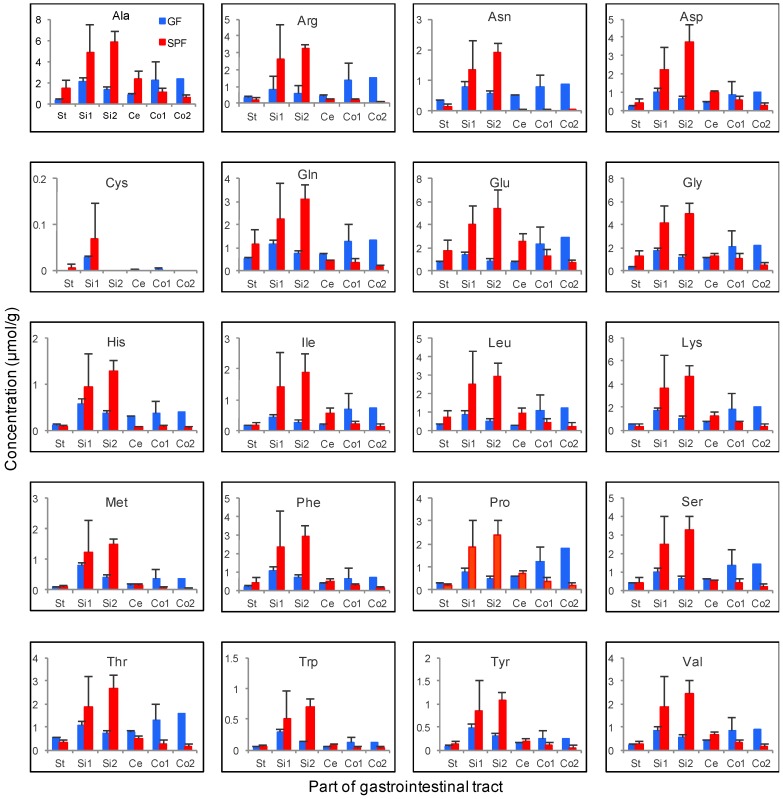
Figure 6.
Luminal amino acid profiles of the gastrointestinal tract in SPF and GF mice. The line graphs indicate the average concentration of amino acids in the gastrointestinal contents. The red and blue lines indicate the SPF and GF mice, respectively. The error bars indicate the standard error (n = 3). St: Stomach, Si1: Upper small intestine, Si2: Lower small intestine, Ce: Cecum, Co1: Upper colon, Co2: Lower colon.

