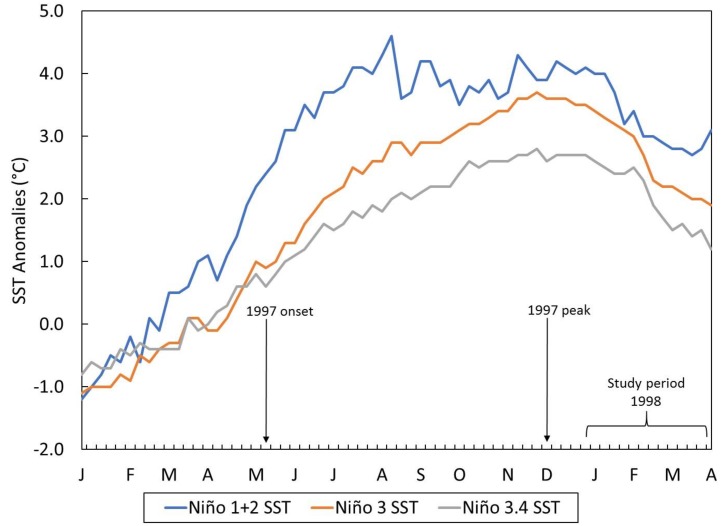
Figure 2.
Weekly time plot of sea surface temperature anomalies (°C) in the central eastern (Niño 3.4), eastern (Niño 3) and coastal upwelling (Niño 1 + 2) regions of the equatorial Pacific Ocean from January 1997 to April 1998. El Niño onset and peak (based on ONI index) and study period are highlighted.

