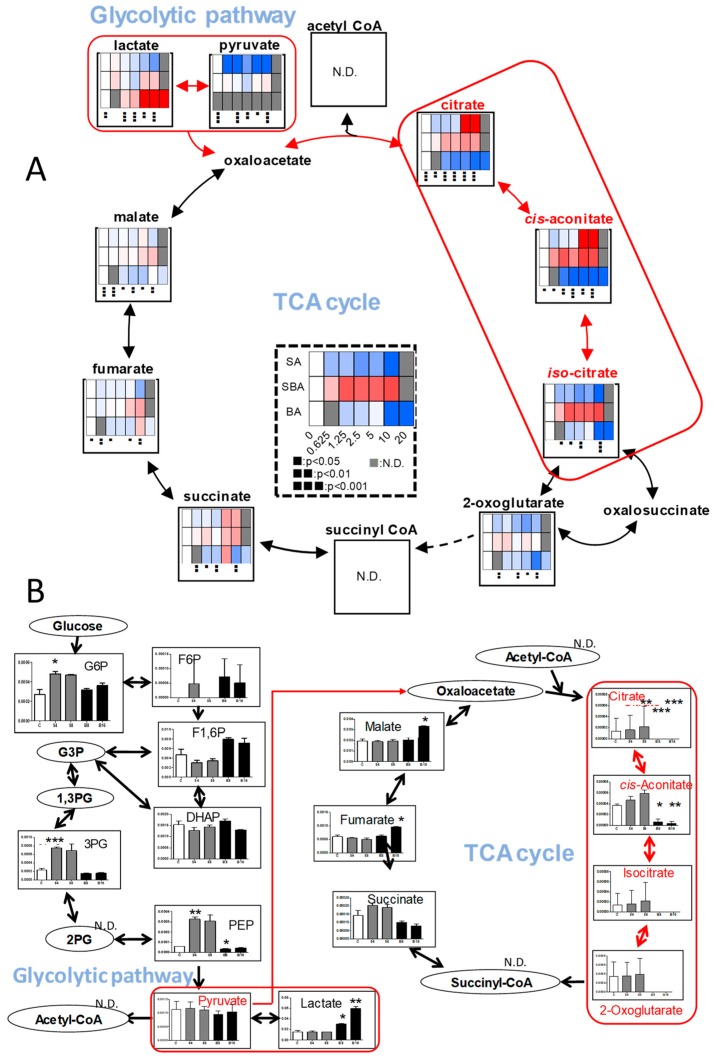
Figure 5.
BA, but not SAB nor SA, inhibits the tricarboxylic acid (TCA) cycle. (A). Dose-response of SBA (60 min), BA (90 min), SA (30 min). HSC-2 cells were treated as Exp. I in Materials and Methods. Averaged values of quantified metabolites (amol/cell) were calculated by triplicate. To visualize the data in heat maps, each of the values were divided by those of 0 mM, i.e. fold changes were visualized and colored. Blue, white, and red were assigned for the fold changes of 0, 1, and 2, respectively. For the treatments of 0.626 mM, Student’s t-tests were used, and for those of 20 mM, no statistical test was conducted. Not detected (N.D.) was colored in gray. One-way ANOVAs were conducted and black boxes were assigned below each heat map. (B). Dose-response of SBA and BA. HSC-2 cells were treated as Exp. II in Materials and Methods..Horizontal axis from left to right: C, S4, S8, B8, and B16 represent control, 4 and 8 mM SBA, 8 and 16 mM BA, respectively. Treatment time: 70 min. Control and each group were analyzed using Welch’s test (both tail) and p-values were adjusted by Bonferroni correction. * p < 0.05, ** p < 0.01, and *** p < 0.001. Error bar indicates standard deviation of triplicates.

