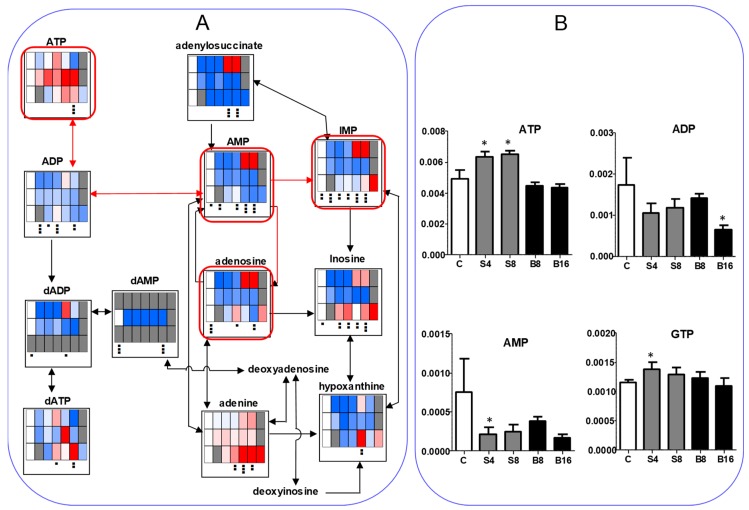
Figure 7.
BA as well as SBA, but not, SA, reduce the ATP utilization. (A). SBA (60 min), BA (90 min), SA (30 min). HSC-2 cells were treated as Exp. I in Materials and Methods. (B). Horizontal axis from left to right: C, S4, S8, B8, and B16 represent control, 4 and 8 mM SBA, 8 and 16 mM BA, respectively. HSC-2 cells were treated as Exp. II in Materials and Methods. Vertical axis, μmol/cell. Each value represents mean ± S.D. (n = 3). The procedures used to produce heat maps and statistical analyses were described in the legend of Figure 5. * p < 0.05.

