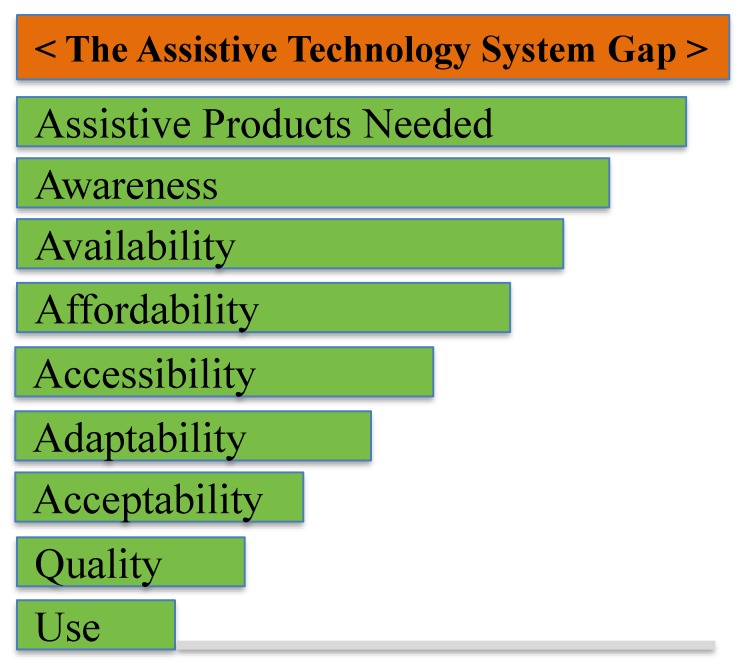
Figure 1.
A schematic representation of the Assistive Technology System gap. Note: This bar chart is not to scale—globally the number of APs needed far exceeds those available, sometimes by a ratio of 10 or more to one, and this is patterned by socioeconomic factors, marginalization and so on. Reproduced with permission from MacLachlan et al. [30].

