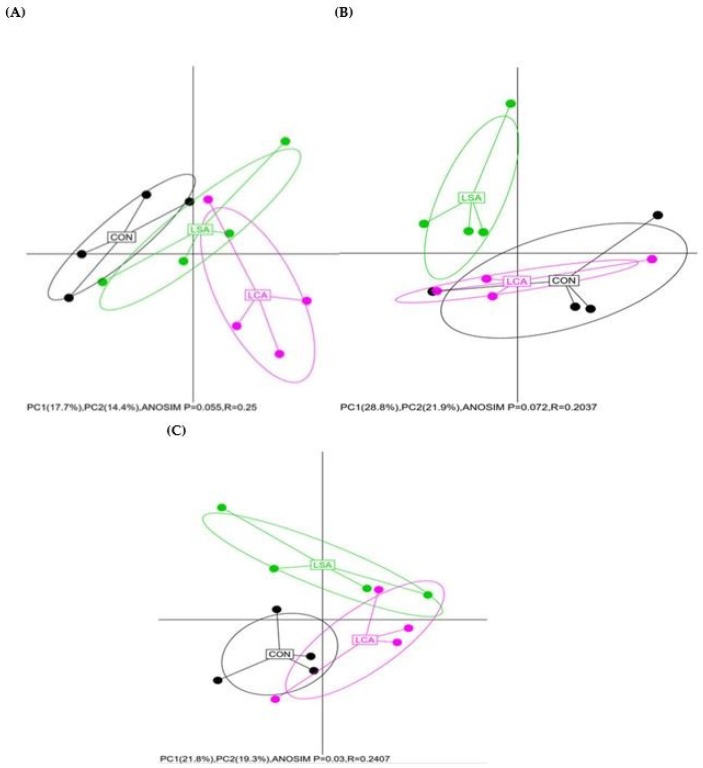
Figure 1.
Principal component analysis (PCA) of bacterial community structures in the three treatments of the ileum (A), colon (B) and rectum (C). The percentage of variation explained by the x axis represented by PC1 and the y axis represented by PC2 are indicated in the axis. A = ileum; B = colon and C = rectum. CON = control; LCA = low cocktail of antibiotics concentration; LSA = low concentration of single antibiotic. The percentage of variation explained by PC1 and PC2 are indicated in the axis, and the ellipses represented with 95% confidence. R-values closer to 0 denote groups not significantly different from one another, while values closer to 1 denote a highly different community composition, P value ≤ 0.05 is significantly different.

