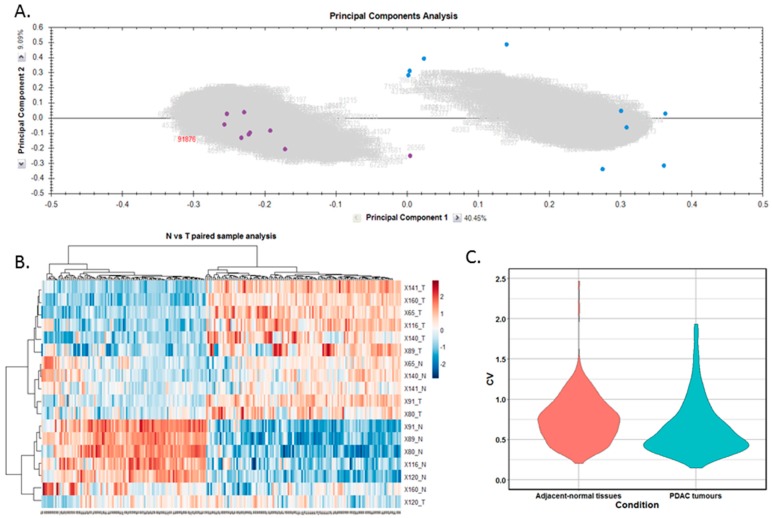
Figure 2.
Proteomic clustering of pancreatic cancer tumours and adjacent-normal tissues. (A) Principal component analysis from Progenesis QI for Proteomics shows separation of the pancreatic ductal adenocarcinoma (PDAC) tumours (purple, n = 9) and the adjacent-normal tissues (blue, n = 9). (B) Heatmap using unsupervised Pearson clustering of all differentially expressed proteins visualises their expression levels for each sample. (C) The CV was calculated for each DE protein in the sample groups, and those values are displayed as violin plots.

