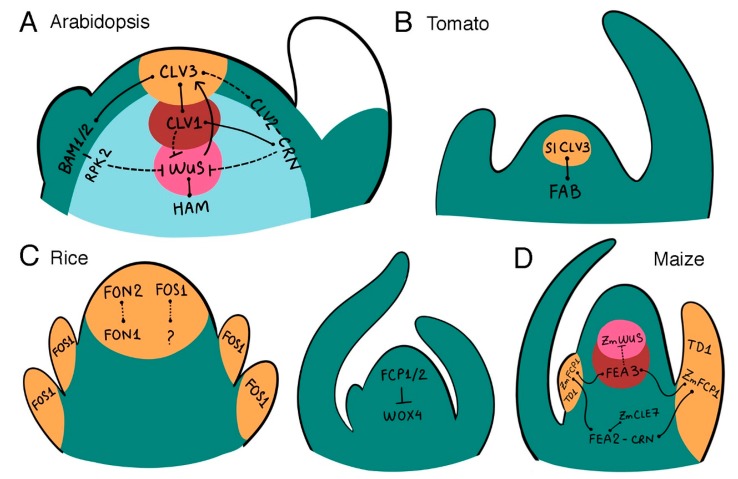
Figure 2.
CLV-WUS signaling pathways in model and crop plant meristems. (A) Arabidopsis SAM. (B) Tomato SAM. (C) Rice FM and SAM. (D) Maize SAM. Genes with characterized genetic and/or biochemical interactions are shown. Arrows depict positive regulation and bars depict negative regulation. Solid lines represent direct interactions and dashed lines represent indirect interactions. Solid lines with rounded ends depict direct peptide–receptor interactions. Unidentified receptors for peptides are denoted by question marks.

