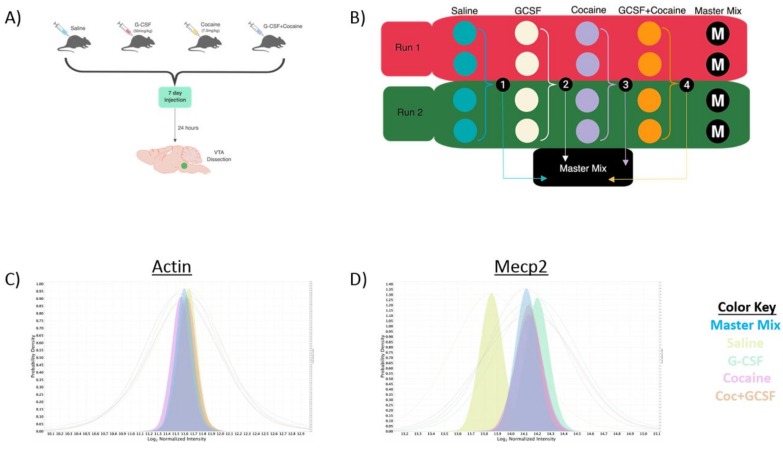
Figure 1.
Experimental design and validation. (A) Animals were injected with ± G-CSF (50 μg/kg) ± Cocaine (7.5 mg/kg) a 2 × 2 design. Injections were done once daily for 7 days and animals sacrificed 24 h after the final injection and the VTA dissected out for analysis. (B) To allow for significant power, two runs of the TMT 10-plex were run with two samples from each group per run (total 4/group) with a mix comprised of an equal amount of each sample run as a Master Mix run to allow normalization between runs. Median intensity values of actin, which was not significantly changed in any group show near complete overlap (C) whereas Mecp2 shows increase in all non-saline groups with the expected change in median intensity (D).

