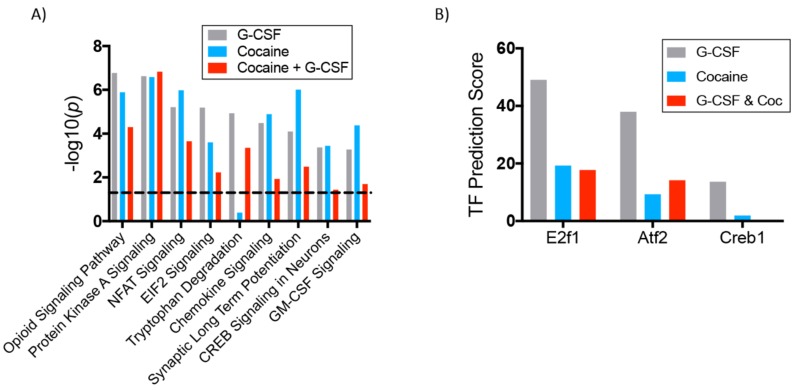
Figure 7.
Canonical pathways regulated in all groups and predicted transcription factors of upregulated proteins. (A) Ingenuity Pathway Analysis software was used to compare significantly altered canonical signaling pathways amongst all treatment groups. The height of the bars represents the statistical strength of the change but does not represent directionality of change. Directional data available in Table S6. (B) Using Enrichr software we identified transcription factors with the highest predicted number of targets in our datasets. This graph demonstrates the calculated transcription factor (TF) prediction score for the three chosen transcription factors. Significantly regulated targets are available in Table S9.

