Figure 1.
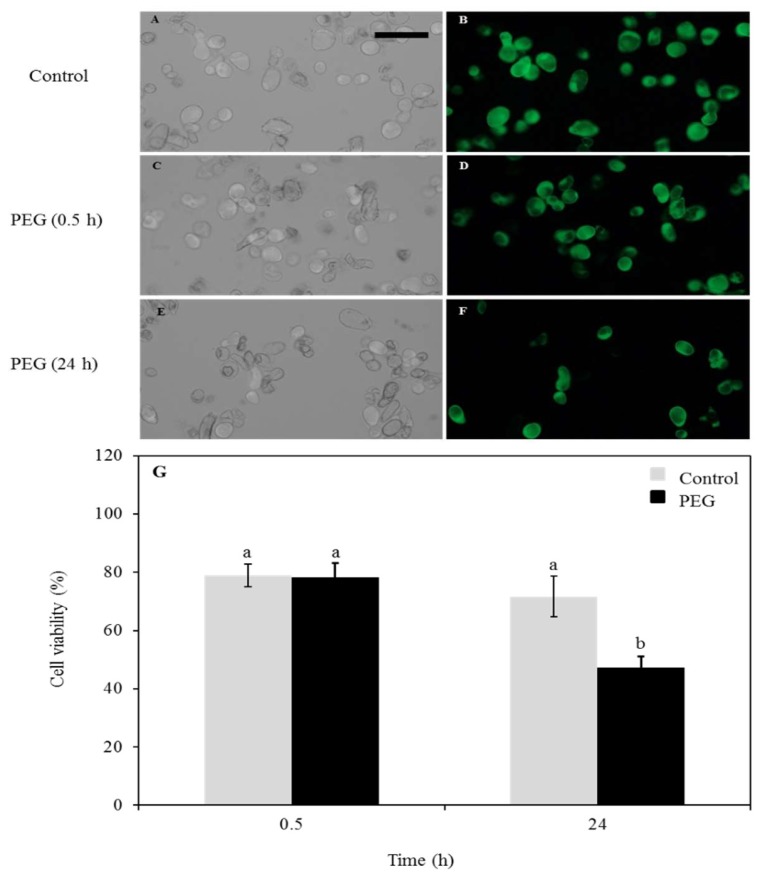
Arabidopsis thaliana cell viability assessed with FDA after treatment with 40% PEG. (A) Control (mock-treatment) cell count under bright-field microscope. The bar indicates 100 µm. (B) Control (mock-treatment) cells under the fluorescent microscope. (C) Cells after 0.5 h treatment under bright-field microscope. (D) Cells after 0.5 h treatment under fluorescent microscope. (E) Cells 24 h post-treatment under bright-field microscope. (F) Cells 24 h post-treatment under fluorescent microscope. (G) Diagram showing a comparison between control and treated cells after 0.5 h treatment and 24 h post-treatment; a, non-significant change (>0.05); b, significant change (<0.05).

