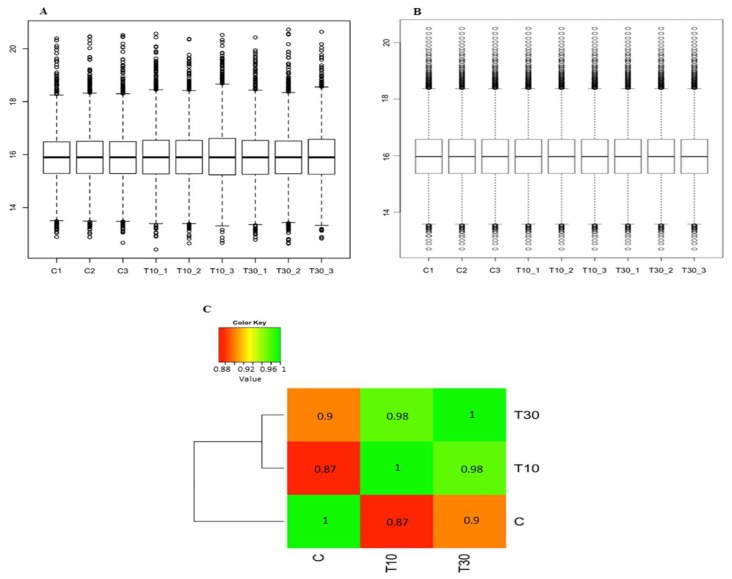
Figure 2.
Diagrams showing the distribution of TMT-labelled sample after applying bioinformatics analysis. (A) Normalisation on the peptide level using variance stabilising normalisation. (B) Normalisation on the protein level using median. (C) Heatmap showing normal correlation with distinct distribution between the control and the treated samples. Control, C; 10 min treatment, T10; 30 min treatment; T30.

