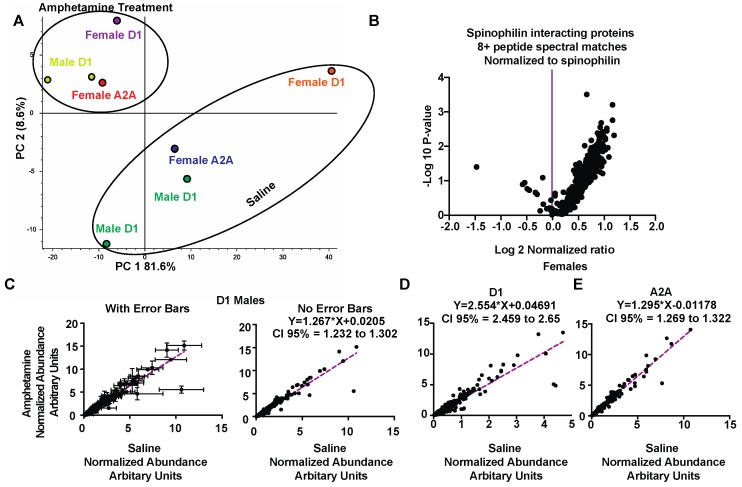
Figure 3.
Greater abundance of spinophilin interacting proteins in amphetamine-treated animals occurs across both sexes and cell types. (A) Principal component analysis of individual samples normalized to spinophilin abundance within each sample and filtered for eight or more PSMs. (B) A volcano plot showing a majority of the proteins have increased abundance in HA immunoprecipitates isolated from amphetamine treated animals when normalized to the amphetamine-dependent increase in spinophilin abundance. (C) A plot of the abundance of spinophilin interacting proteins isolated from male, D1 Cre expressing animals and normalized for spinophilin expression (Table S2) and quantified from treated (Y-axis) or control (X-axis) samples. Left panel shows mean ± standard deviation, the right panel just shows the mean of the two values. (D) A plot of the abundance of spinophilin interacting proteins isolated from female, D1 Cre expressing animals and normalized for spinophilin expression (Table S2) and quantified from treated (Y-axis) or control (X-axis) samples. (E) A plot of the abundance of spinophilin interacting proteins isolated from female, A2A-Cre expressing animals and normalized for spinophilin expression (Table S2) and quantified from treated (Y-axis) or control (X-axis) samples.

