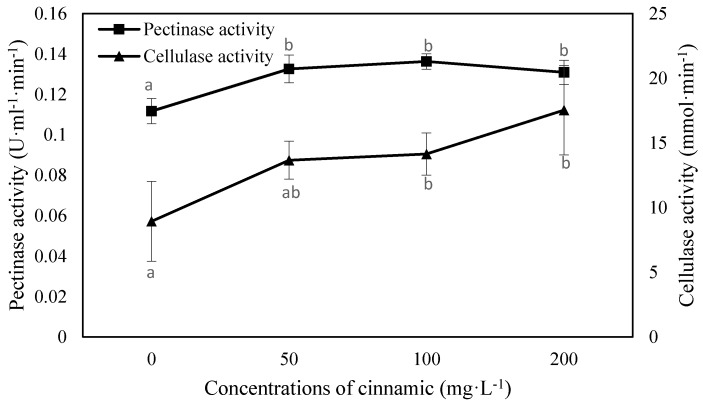
Figure 5.
Effects of cinnamic acid at various concentrations on pectinase and cellulase activity of FOF. Data are average values, with bars representing standard errors of three replicates. Different letters for each index indicate significant differences at p < 0.05, according to Duncan’s test. Significant differences are labelled “a”, “ab”, and “b”.

