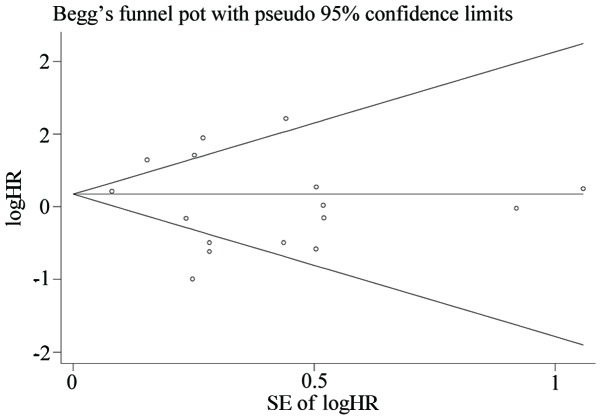
Figure 2.
Begg's funnel plot of OS group. The meta-analysis for microRNA expression levels and OS in patients with lung cancer was analyzed using a funnel plot because it exceeded the pre-requisite of 10 studies. The y-axis represents the SE (logHR), which served as a measure of precision, where the higher the SE, the less precise the study. The HR has been plotted along the x-axis. The pattern of the study was symmetric which indicated that the bias of the study was small. SE, standard error; logHR, log hazard ratio; OS, overall survival.

