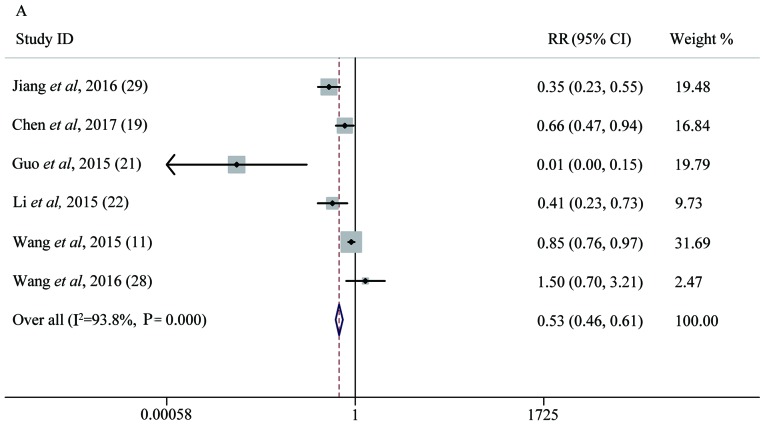
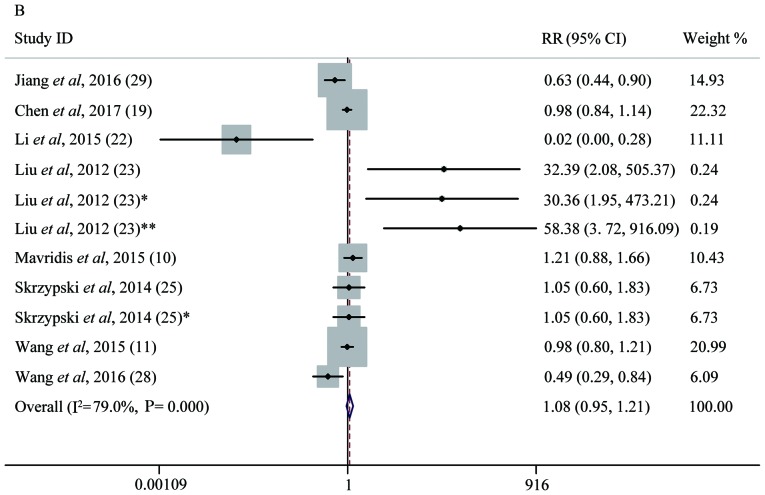
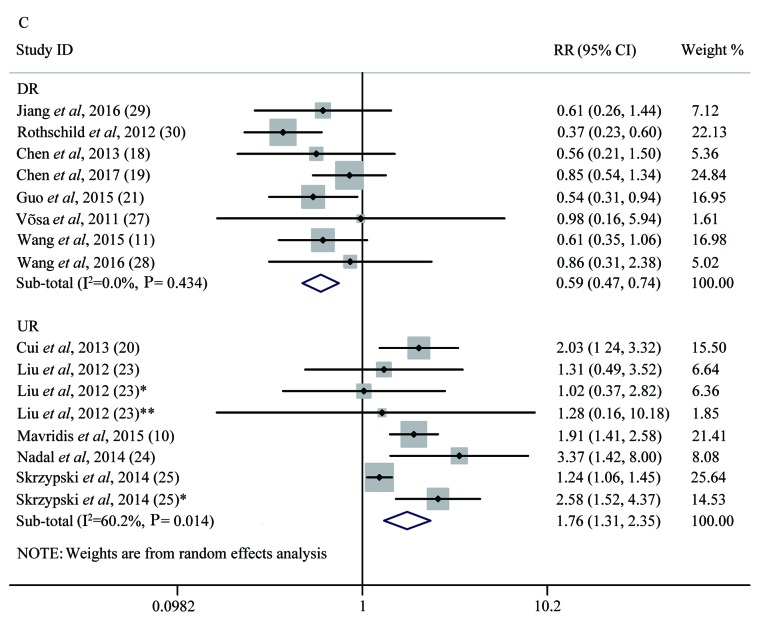
Figure 4.
Forest plot analysis. (A) Forest plot of the LNM group. (B) Forest plot of the T group. (C) Forest plot of the OS group. Each plot A-C corresponds to the meta-analysis of a different group: (A) LNM, (B) T, and (C) OS. The effect size for the estimate of each study was presented as a grey square proportional in size to the weight of that study. The confidence interval around that effect size was presented as a horizontal line. The vertical line across these estimates represents HR=1 and any horizontal line crossing this vertical line represents a non-statistically significant result. The summary effect size was presented as a rhombus, the center of which represents the summary effect size and the width of which represents its CI. All meta-analyzed groups, apart from the T group (plot B), were statistically significantly associated with microRNAs. LNM, lymph node metastasis; RR, relative risk; CI, confidence interval; T, tumor stages of cancer; OS, overall survival; DR, downregulated; UR, upregulated.


