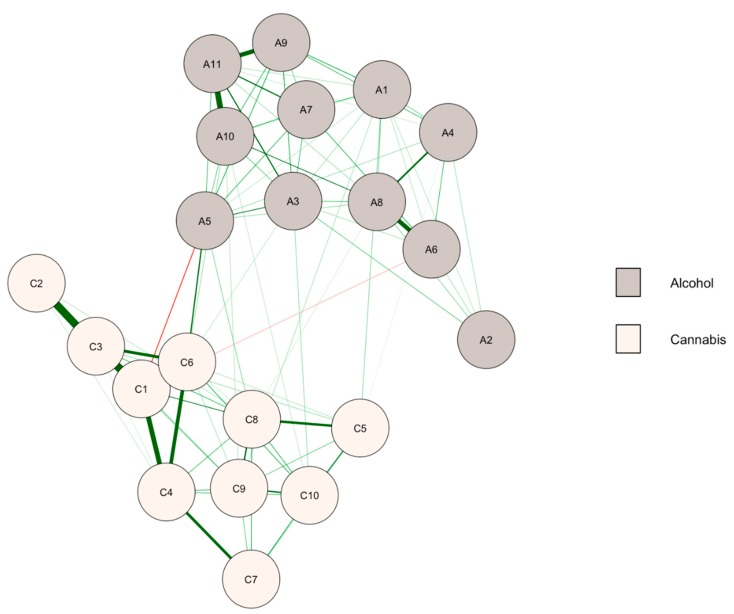
Figure 1.
Network of alcohol and cannabis symptoms at baseline (n = 1559). A1–A11: symptoms of alcohol use disorder, C1–C10: symptoms of cannabis use disorder (see Table 1 for labels). Green (or red) paths are positive (or negative) regularized logistic regression weights. Thicker edges indicate a stronger relationship between symptoms. Node colors are defined according to the community detection analysis.

